My First Infographic made with Piktochart
This week we worked on making infographics using apps on our iPad. Infographics are a great way to convey information to students in a short and concise way that's also very visually appealing. I used the app Piktochart to make my infographic, which is an app that's free on the App Store, though you can buy some premium options and is used for beginning graphic design purposes. Here's a tutorial on how to use Piktochart, and a link to my Pinterest board full of infographics inspiration.
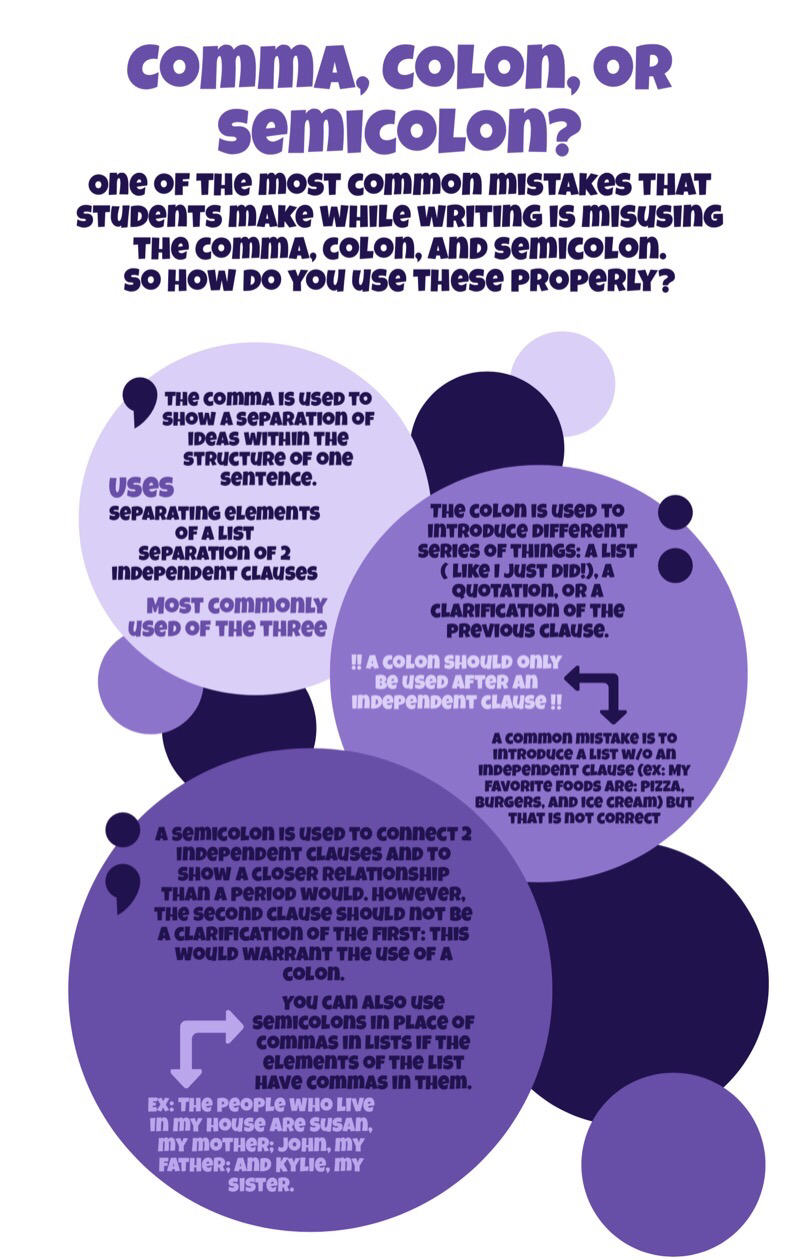
I chose to create my infographic on the topic of commas, colons, and semicolons. With Piktochart I was able to put together text, icons, and shapes into one cohesive body that conveys the information easily and effectively. Piktochart is a good app to use for this, though it had some of the same limitations that I found using Canva on the iPad too in that they're not programmed for very minute and exact movement of elements on the screen, which is what you need for a successful design. Nevertheless, the app was easy to learn and had a lot of options for design elements that were free and looked good in the final product.